하이브의 유용한 정보와 소식을 전달드립니다! Hello from Hive Platform. 😊
When operating a game, many questions arise as you evaluate the results of updates and events.
How far have users progressed through the new content after an update?
At which stage of the tutorial do new users drop off the most?
Do users continue playing after participating in an event?
To answer these questions, you first need to extract data generated within the game, process it according to the necessary criteria, and analyze user behavior.
Whenever a new question arises, you may need to request data from an analytics team or wait for a predefined report. If the analysis criteria change, the same process may have to be repeated.
In this edition of Hive Insight, we introduce the key features of the newly enhanced Hive Analytics and show how you can use them to explore user behavior based on your preferred criteria. |
|
|
💡Easy Integration, Greater Flexibility in Analysis |
|
|
To analyze game data, you first need to collect the necessary data and prepare it in an analysis-ready format.
When you integrate the Hive SDK, standard game events such as login and payment events are collected automatically. User-defined events created specifically for your game can also be included in the analysis.
Building on this data collection environment, the newly enhanced Hive Analytics adds greater flexibility for configuring the scope and criteria of your analysis.
Freely combine events and metrics, and set your analysis criteria directly on the screen. Build charts, funnels, and retention analyses to find the insights you need—without writing SQL or exporting data separately. |
|
|
📈 Explore User Behavior Flows |
|
|
Use charts, funnels, and retention analysis to examine changes in user behavior based on your operational needs. |
|
|
Charts That Reveal Trends |
|
|
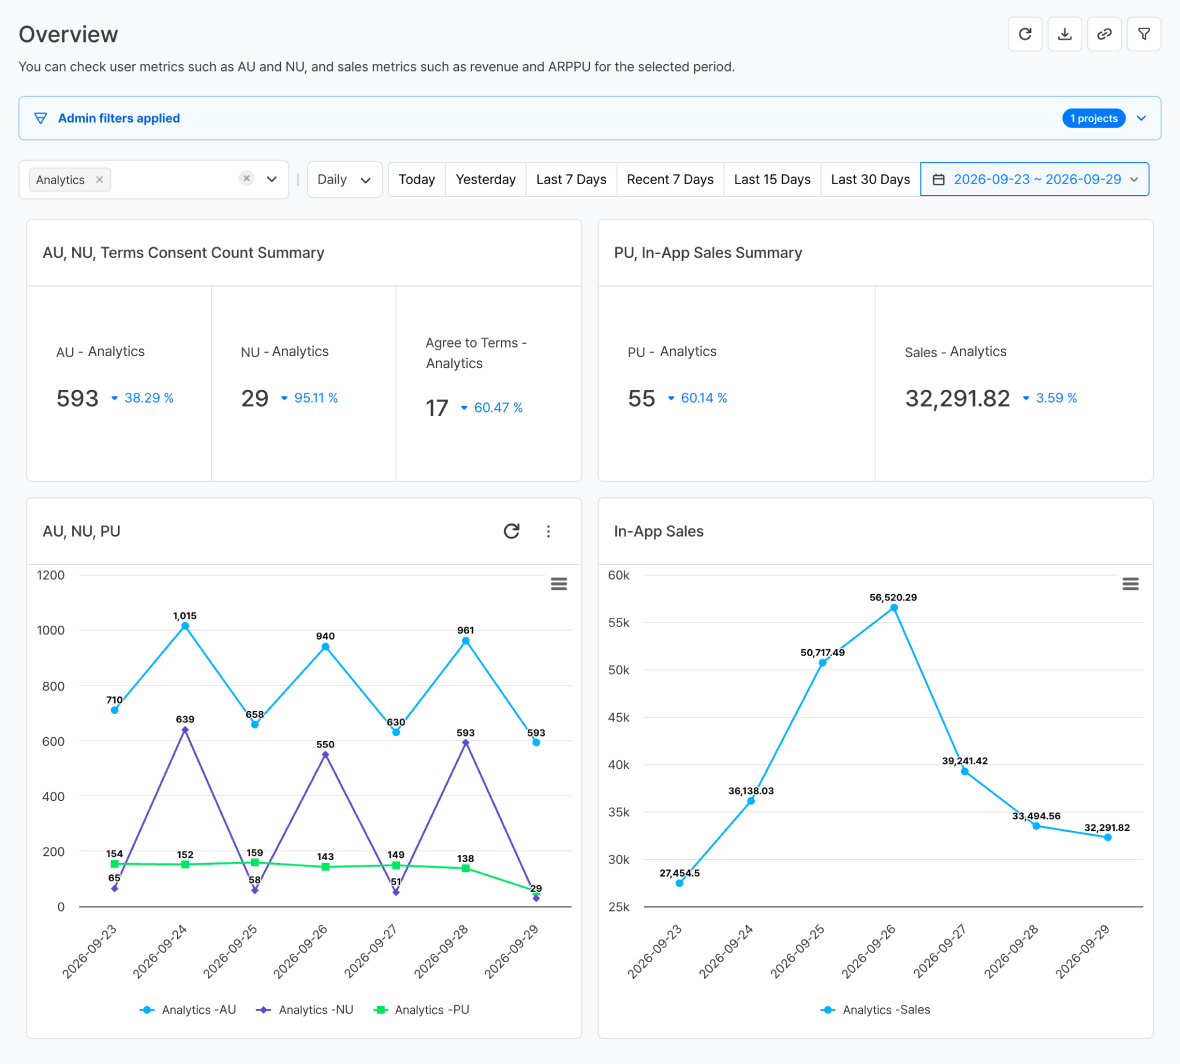
Charts combine events and metrics to show how key indicators change over time.
Compare trends before and after an update or event, and apply conditions such as country, server, and app version to identify changes within specific user groups. |
|
|
Funnels That Identify Drop-Off Points |
|
|
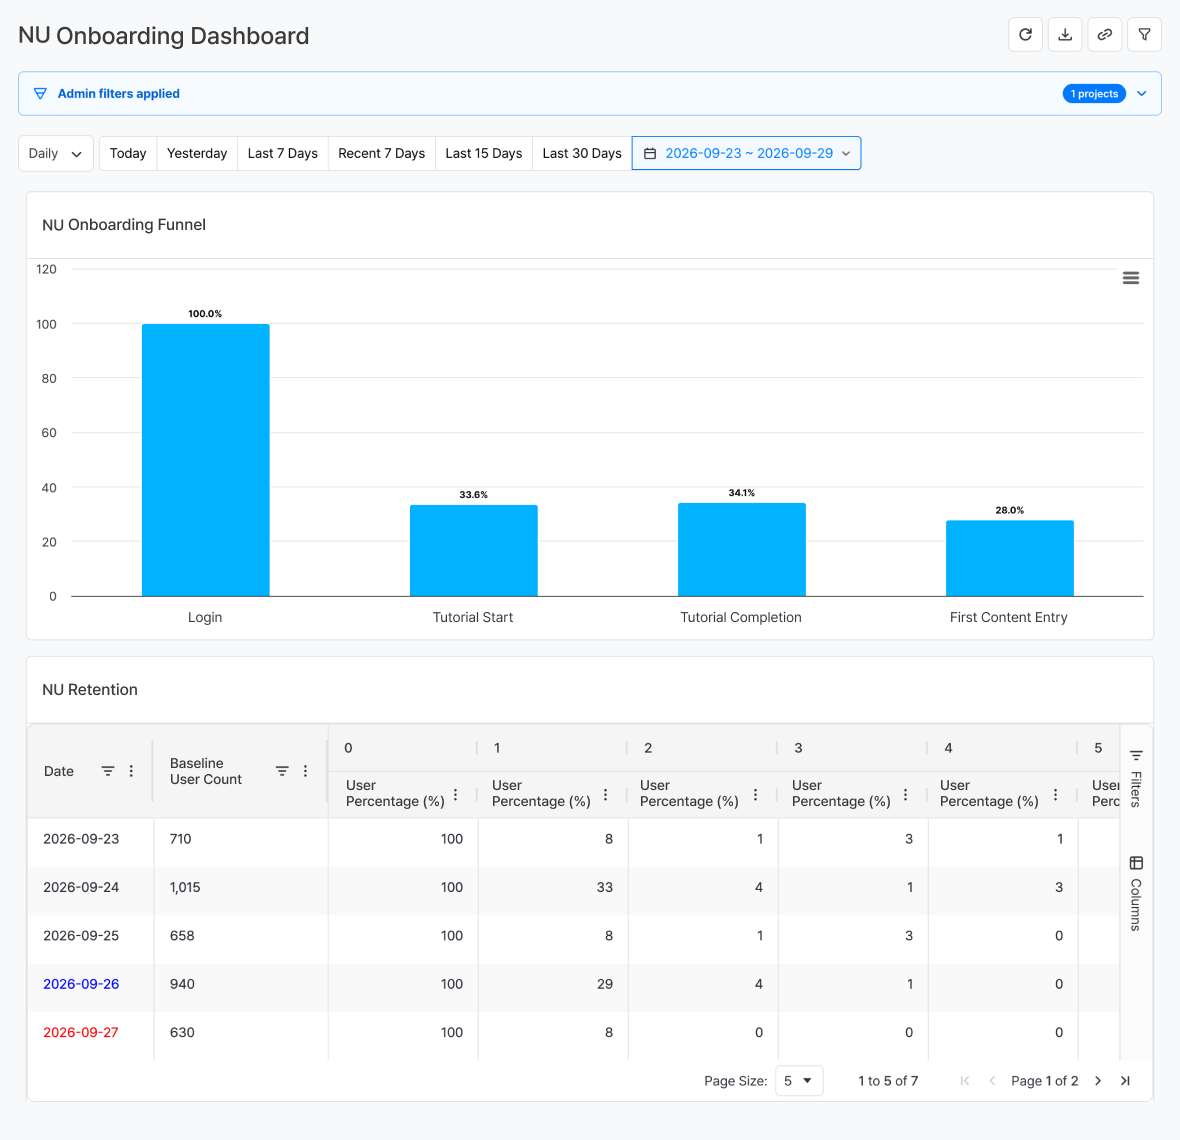
Funnels organize sequential actions into stages, such as progressing from the start to the completion of a tutorial or from entering content to clearing it.
Compare the number of users and conversion rate at each stage to identify where users are most likely to drop off. |
|
|
Retention Analysis for Continued Engagement |
|
|
Retention analysis shows whether users return or repeat the same action after completing a specific behavior.
Review the return trends of users who experienced new content or participated in an event, and determine whether that experience led to continued engagement. |
|
|
🔍 Put Your Analysis Results to Work |
|
|
Examine the changes identified through analysis at the individual user level, and connect those insights to your live operations. |
|
|
Bring Key Metrics Together in a Dashboard |
|
|
Bring frequently viewed charts and analysis results together in one dashboard to review key metrics and trends at a glance. Dashboards created on PC are also available on mobile devices. |
|
|
Review Individual User Activity |
|
|
View a specific user’s events and activity history in chronological order. This helps you examine which user behaviors contributed to changes identified in your overall metrics. |
|
|
Connect Acquisition Data to Post-Install Behavior |
|
|
When you integrate an MMP, metrics by acquisition source are provided alongside your analytics data. Compare user behavior and advertising performance within a single analytics environment. |
|
|
Connect Analyzed User Groups to Campaigns |
|
|
Extract users who meet your analysis criteria as user segments, then connect them with Promotions and Notifications for targeted campaigns. |
|
|
🎯Use Case: New User Onboarding Analysis |
|
|
Let’s look at new user onboarding as an example of how to apply the features introduced above.
With an MMP integration, you can build a single funnel covering the user journey from installation and game launch to login, tutorial start and completion, and entry into the first piece of content.
Install → Launch Game → Log In → Start and Complete Tutorial → Enter First Content
Compare the number of users and conversion rate at each stage to identify where the most drop-offs occur. Apply conditions such as country, operating system, and app version to examine differences among specific user groups.
After making improvements, compare conversion rates with those from an earlier period to see how user behavior has changed. If needed, extract users
who dropped off at a particular stage as a segment and connect them to a campaign that provides helpful information or benefits. |
|
|
🤖 Expand Your Analytics Experience with an AI Agent
|
|
|
Ask the Analytics AI Agent what you need to know, and it provides answers based on Hive Analytics events. Organize the related analysis results into a dashboard for an at-a-glance view. |
|
|
Analyze what matters to your game with the criteria you need,
and explore changes in user behavior and key metrics. |
|
|
Com2us Platformcs-platform@com2us.com
131, Gasan digital 1-ro, Geumcheon-gu, Seoul, Korea
© Com2uS Platform Corp. All Rights Reserved.
This email is for informational purposes to guide service usage.
If you no longer wish to receive emails, please click here to unsubscribe.
|
|
|
|